EURO
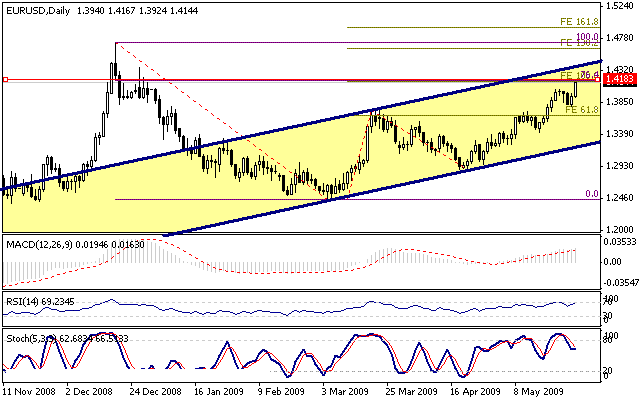
Despite the pair failed to successfully breach the 1.3350 level, we see signs of short term incline as seen in the above image and we see the pair was The pair inclined to extend its target above what we had expected in our previous analysis in May as it continued to incline to breach critical resistance levels at 1.3545 and 1.3865 which altered the medium term trend to the upside.
Monthly Technical Analysis - June 2009
_________________________________________________________
-----------------------------------------
GBP
A strong uptrend for the cable towards levels above 1.60 as it was able to maintain trading above this level during the past period may be what is needed in the upcoming period.
-----------------------------------------
JPY
High volatility during the last month was witnessed as the USD/JPY pair declined where we expect further declines as far as trading maintains levels below 98.40 and 97.65.
-----------------------------------------
CHF
The pair declined and ended the month with a significant drop yet closed above the 1.0660 level which will determine the trend for the month.
-----------------------------------------
CAD
A sharp decline last month was able to breach the critical support levels which may open for further declines this month as well.
In the above image, we see the pair ended the month just below the 1.4185 resistance level which represents the 76.4% and 100% Fibonacci expansion. Despite this level, the pair remains to the upside targeting 1.4365 with possibilities of witnessing a slight downside correction.
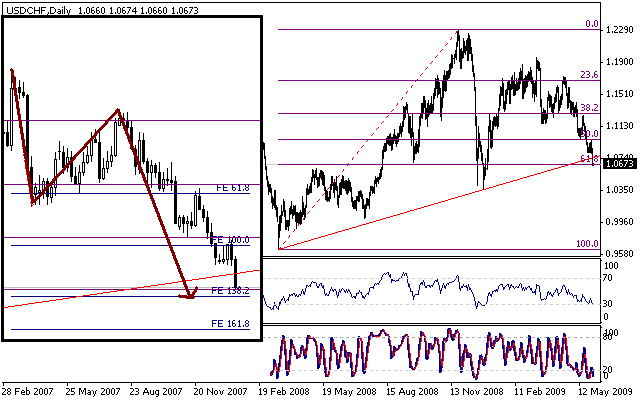
We see that the 1.0660 level represents the 61.8% correction for the upside wave as it resides ahead of the 138.2% expansion at 1.0615 as seen in the secondary image. Momentum indicators show the pair being oversold which may result in an upside correction to retest 1.0760 which is the key support for the uptrend broken last month. We still believe the pair is to decline further towards the 161.8% expansion at 10.420 yet may be stalled due to the upside correction expected.
_______________________________________________________________________________________________________
---------- EDUCATION --------
-----TRADING METHODS ------
--------- FOR TRADERS --------
------------ OTHER -------------
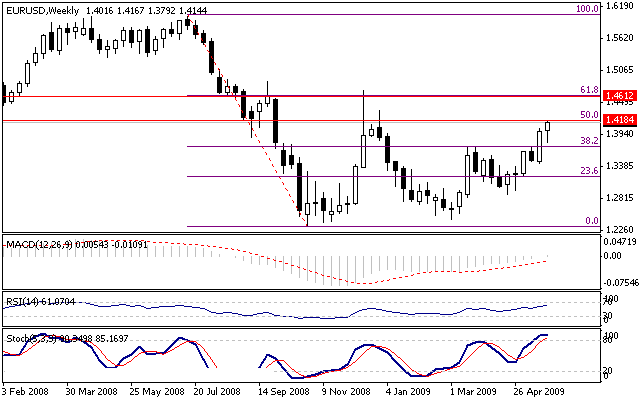
On the weekly charts, the 1.4185 proves its strength as it represents the 50% correction for the downside wave that started on 13-07-2008 and ended on 26-10-2008 yet at the same the weekly close was above 1.4065 which assures the fact that the pair may be trapped between the 1.4185 resistance and the above support level on the short term resulting in a slight downside correction
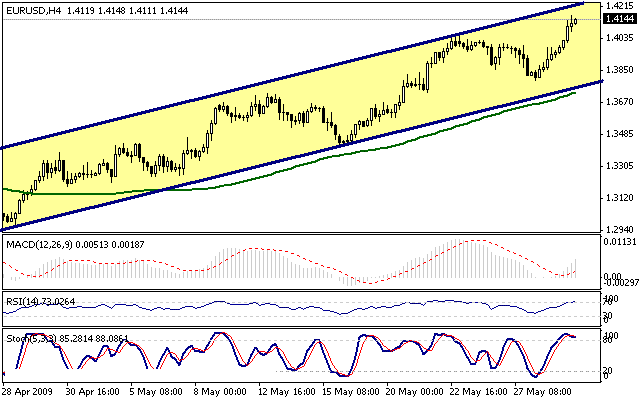
Looking closer at the four hour charts, we see an ascending channel with a key resistance at 1.4215 1.4230 yet the pair is being overbought on momentum indicators despite the positive signs from the MACD indicator. We still believe the pair is to correct to the downside yet the trend remains to the upside as far as 1.3725 (the 100 MA) remains intact.
From here dear reader, we see that the pair is in an uptrend targeting 1.4615 at the very least representing the 61.8% correction on the second image yet the same time a slight downside correction may be witnessed. However as far as 1.3725 remains intact on the intraday and short term and 1.3545 on the medium term remain intact, the uptrend continues.
Support 1.4065 1.3865 1.3715 1.3545 1.3325
Resistance 1.4185 1.4230 1.4365 1.4510 1.4615
Recommendation According to our analysis, we believe the pair is to gather bullish momentum from 1.4065 with targets at 1.4365 and 1.4510 yet if trading reverses to maintain levels below 1.3715, our upside movements become invalid
In the above image, the pair is trading above the 161.8% expansion at 1.6050 which is also the 38.2% correction for the downtrend that started on 15-07-2008. Building a solid base above 1.6050 opened the way for the pair to target the key resistance for the channel at 1.6370 1.6385 which is the initial target for this month. Overbought signals are appearing on momentum indicators which may result in high volatility yet as far as 1.6050 remains intact, the uptrend remains
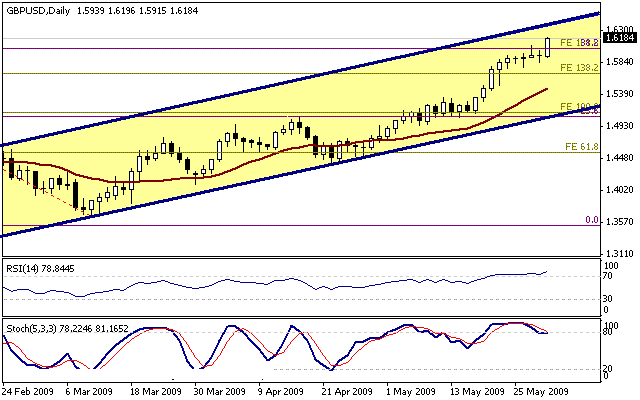
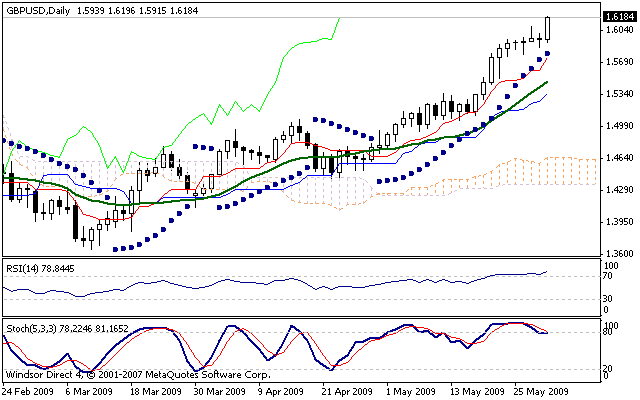
Looking at momentum and direction indicators, the pair is inclining heavily as it moves away from the Ichimuko cloud supported by the Tenkan Sen and Kijun Sen at 1.5745 and 1.5355 where the 100 day MA resides at 1.5480. The Parabolic Sar at 1.5790 is also supporting the pair to the upside targeting 1.6370 as far as 1.5480 remains intact. On the other hand, the overbought signals seen on momentum indicators may result in a slight downside correction.
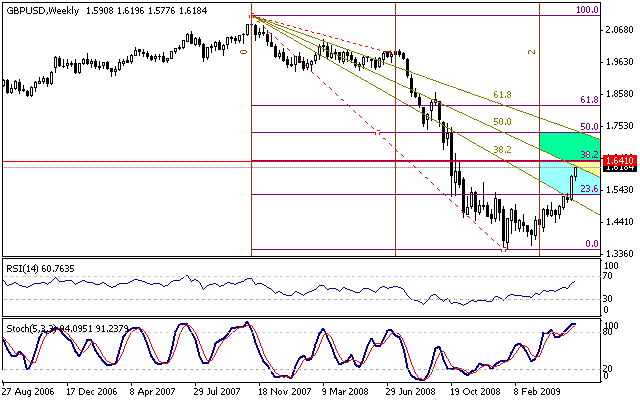
Analyzing time zones, we believe the pair is to continue inclining until 29-11-2009 where we see it targeting the 38.2% correction for the long term decline at 1.6410 which may stall further upside movements to exit an overbought area yet the general trend remains to the upside.
From here we see the overall trend this month to the upside with slight volatility and downside correction from time to time yet as far as 1.5745 remains intact, the upside movements will continue on the short and medium terms.
Support 1.6050 1.5890 1.5790 1.5590 1.5355
Resistance 1.6280 1.6385 1.6410 1.6585 1.6735
Recommendation According to our analysis, we believe the pair is to gather bullish momentum targeting 1.6410 at the very least as far as 1.5745 remains intact.
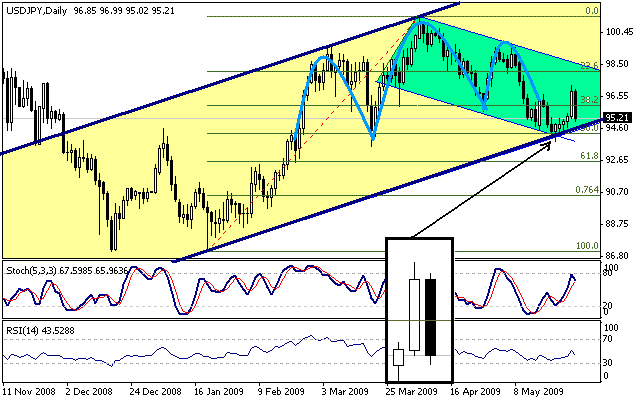
In the first image, we see that a bearish candlestick structure on the weekly charts has been formed supported the bearish technical pattern that is targeting the 76.4% correction at 90.50. The only two obstacles for the pair remain the 94.50 support level and the 50% correction at 94.30 where a breach of these levels to the downside will take the pair towards 93.60 and then to the 61.8% correction at 92.60 to mark the initial target for the month. As far as trading remains below 98.40, the downside trend prolongs.
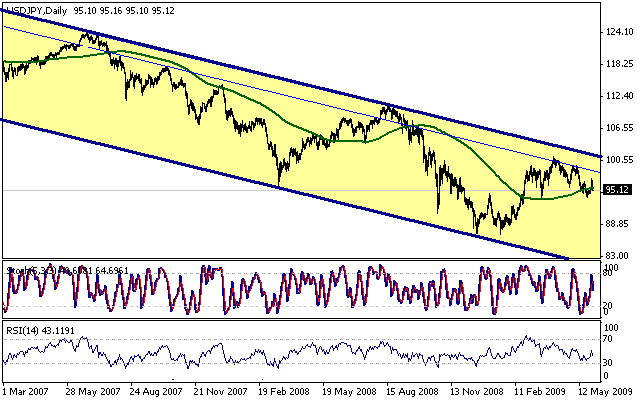
The second image highlights the medium term downside trend with a key resistance at 101.30 and a minor resistance at 98.60 supporting our downside direction on the medium term as far as trading remains below the latter. The 100 day MA at 95.60 will be the pivot point for the month where a breach of this level will take the pair to retest the levels between 96.40 and 97.45.
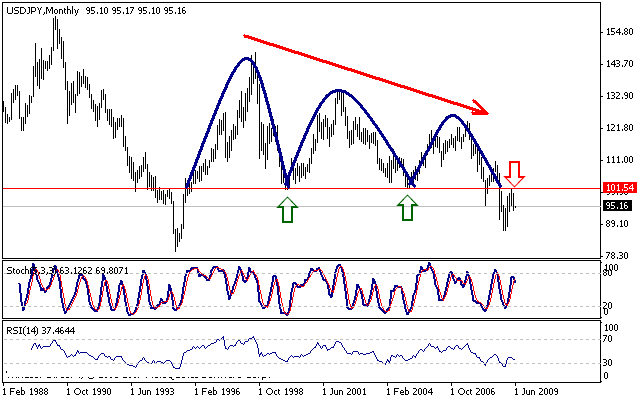
Simply, all the upside movements that occurred for the pair were nothing more than an attempt to retest the broken neckline for the classical bearish pattern at 101.30 and therefore as long as trading remains below this level on the medium term and 98.40 on the short term, the downside trend prolongs.
Support 94.50 93.60 92.60 90.50 89.75
Resistance 96.80 97.65 98.40 99.60 100.70
Recommendation According to our analysis, we see the pair is to gather bearish momentum from 96.80 with targets at 92.60 yet a daily close above 98.40 may stall the projected movements
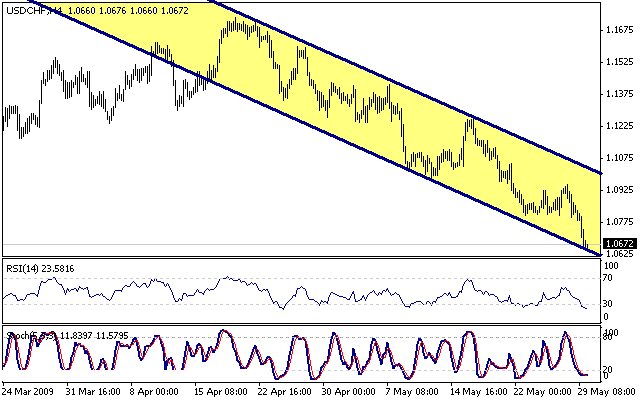
The four hour chart shows a downside channel with a key resistance at 1.1025 and a minor resistance at 1.0825 which has formed due to a series of lows between 22-28 of last month where as far as trading remains below these levels, the downside movements will continue. Note that upside corrections may be witnessed from time to time in an attempt to gather bearish momentum.
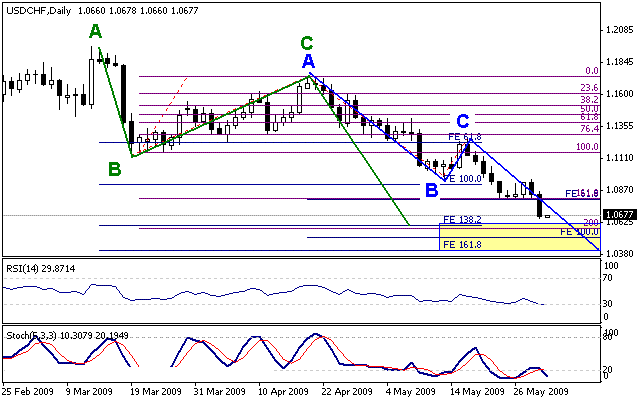
Harmonically speaking, we see the pair is to target levels between 1.0605 and 1.0415 where the 1.0510 level marks a pivot point with several harmonic targets yet again, an upside correction may take the pair towards 1.0740 before continuing the downside movements.
From here we see the pair is to continue declining over the month with high volatility in an attempt to test the 1.0510 level resulting in a slight upside correction, this correction will not pass 1.1025 and will reverse back to the downside where a breach of the 1.0510 level with a daily close below this will open the way for the pair towards 1.0235 at the very least.
Support 1.0660 1.0615 1.0510 1.0420 1.0235
Resistance 1.0740 1.0825 1.0980 1.1025 1.1220
Recommendation According to our analysis, we believe the pair is to decline towards 1.0510 before correcting to the upside yet as far as 1.1025 remains intact, the medium term target resides at 1.0235
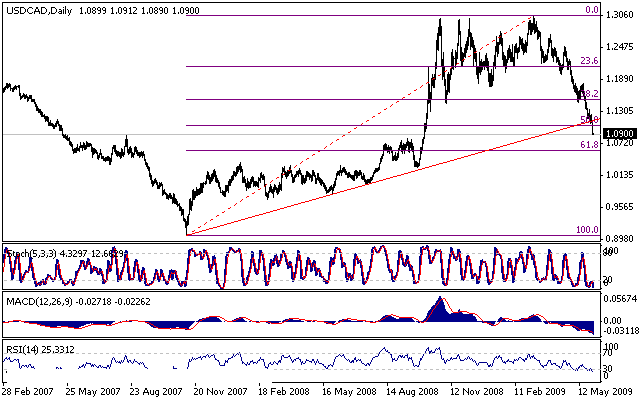
We see several negative signs in the above image after breaching the key support level for the upside direction where at the same time the pair was able to breach the 50% correction. Levels between 1.1115 and 1.1065 will determine the next trend where a breach to the downside will take the pair to the 61.8% correction at 1.0605. Looking at momentum indicators, we see the pair being oversold which may result in an upside correction yet as far as 1.1115 remains intact, the downside trend will continue
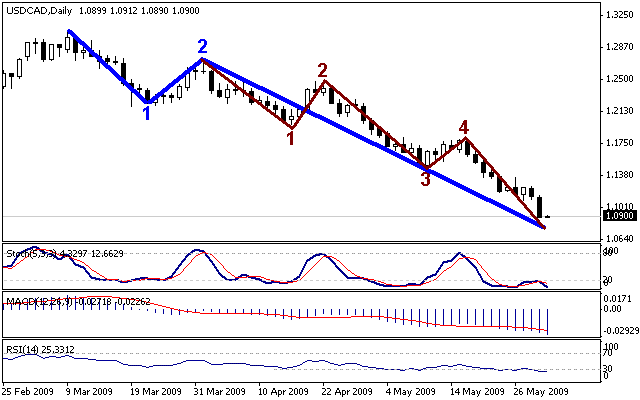
Taking a closer look at the daily charts, we see the impulsive wave 3 about to end as the internal fifth wave is about to be reached where an upside correction will occur afterwards towards 1.1225 at the very most if it successfully breaches 1.1530. We expect the internal fifth wave to end at 1.0780.
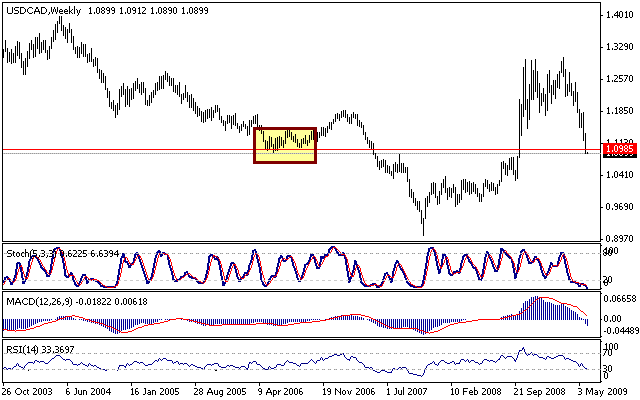
The weekly chart highlights a critical level at 1.0985 which is the pivot point for the general trend. Maintaining trading below this level will reverse the medium term trend to the downside to retest 1.0300 at the very least yet the oversold signals on the stochastic indicators may stall these movements.
Initial downside movements followed by an upside correction which may last a week before reversing back to the downside will be the suggested scenario for this month.
Support 1.0780 1.0685 1.0605 1.0475 1.0305
Resistance 1.1.1065 1.1115 1.1225 1.1265 1.1530
Recommendation According to our analysis, we believe the pair is to decline towards 1.0780 where maintaining levels above 1.0685 will result in an upside correction towards 1.1065 and 1.1115 before reversing back to the downside to target 1.0605. The medium term trend remains to the downside as far as 1.1530 remains intact.


