Open the 4 hour chart and choose whatever currency you want.
Insert the Bollinger Band (20) indicator and be sure that its center line is appearing.
Identify 2 valid lower points OR 2 valid higher points in the Bollinger Band and drop a line from the first to the second line; it will be our break line.
Now when a candle closes above the break line issued from the higher points and in case the center line of the Bollinger band in the 1 hour chart crosses the break line then we have a LONG Trade.
If the candle in the 4 hours chart closes under the break line issued from the 2 lows points and in same time the center line of the Bollinger band crosses the break line in the 1 hour chart, then we are in a SHORT trade.
If the candle in the 4 hours chart closes under the break line issued from the 2 lows points and in same time the center line of the Bollinger band crosses the break line in the 1 hour chart, then we are in a SHORT trade.
I will give an example:
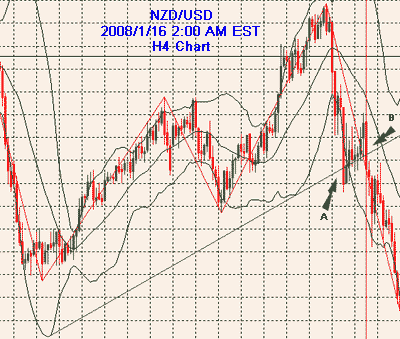
Open the 4 hours chart, open NZD/USD currency and locate the date 2008/1/16 2:00 AM EST
Forex system - H4 Bollinger Band Breakouts
_________________________________________________________
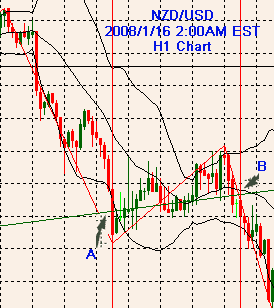
We look at Point (A) in H1 and we locate its center Line (The Center Line of The Bollinger Band), as you remark that the center line didn't cross the Break Line as the candle A did; so it is not a valid sell entry, and as you can see the price go up again. So we wait another opportunity.
We reopen the H4 (4 hours chart) and wait till point (B) is formed, we see the H4 candle crossed the BreakLine, is it a valid sell entry ? we open the H1 chart and locate the Candle (B) , we look at the center line we see the center line crossed the breakLine so we do a short because we confirm the sell entry.

You can see the breakLine I dropped; it is a 2 lows points Bollinger Band which I mention it above
Now wait till a 4 hours candle break the BreakLine, you can see the candle (A) first breaked the Breakline, but is it a valid Sell Entry ? we must confirm it. So we open the 1 hour chart and locate the same Point (A) in the 1 hour chart.

----------- EDUCATION ---------
-------TRADING METHODS ------
--------- FOR TRADERS ----------
-------------- OTHER ------------
---------------------------------------------

_________________________________________________________________________________________________________________________________________
