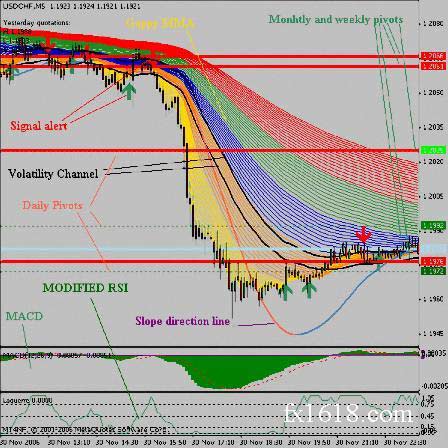
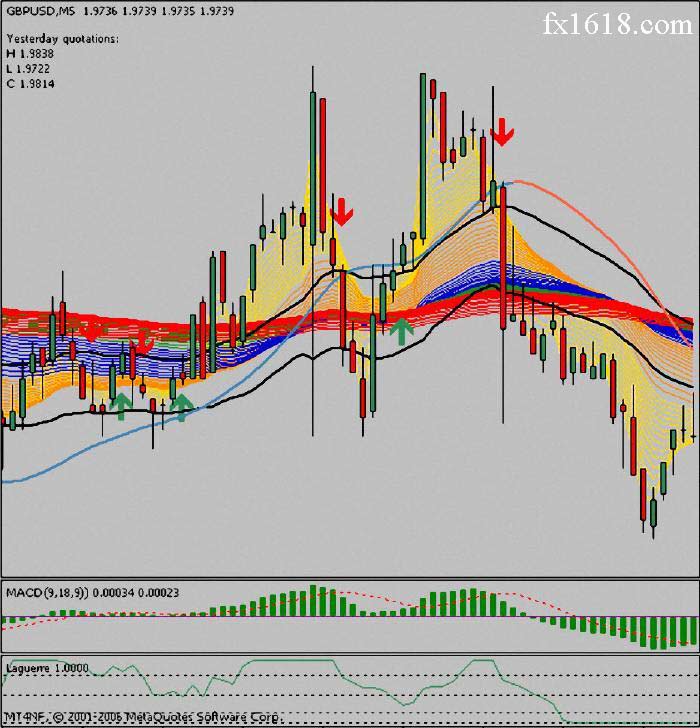
Signal Arrows
The alert is produced by a cross of two Exponential Moving Averages. Faster EMA is 4 and slower EMA is 8.
MACD Histogram
The default settings are (our system uses 5,35,5) :
* Slow moving average - 26 days
* Fast moving average - 12 days
* Signal line - 9 day moving average of the difference between fast and slow.
* All moving averages are exponential.
The signals from the MACD indicator tend to lag price movements. The MACD Histogram attempts to address this problem by plotting the distance between MACD and its signal line. Because of this, the histogram signals trend changes well in advance of the normal MACD signal. It however should not be used alone, therefore we have other indicators to confirm our signal.
Volatility Channel
This is a technique that measures volatility. It consists of 34 EMA high and 34 EMA low. It is not really a part of the system, but I like to see it, especially if I look for confirmation on longer time frame.
Laguerre
This is an advanced form of RSI indicator. The Laguerre Transform provides a time warp such that the low-frequency components are delayed much more than the high-frequency components. Globally, latest bar data has more weight than previous bar data a bit like an exponential moving average.
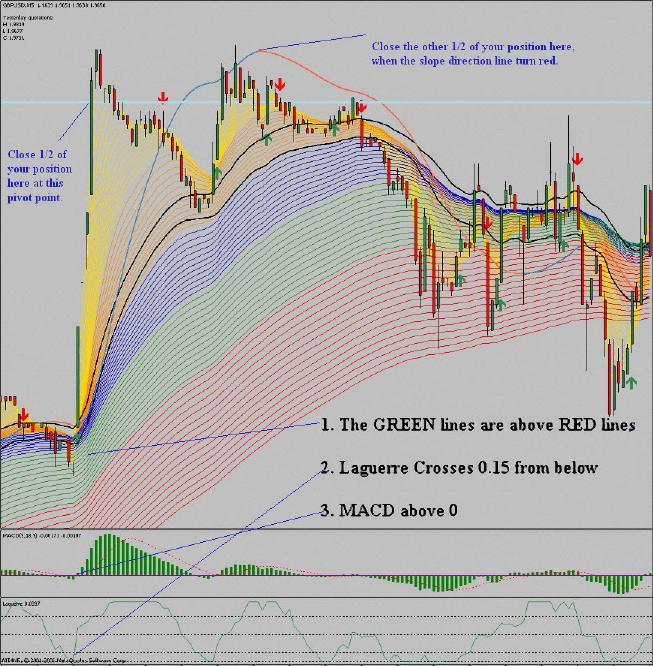
Slope Direction Line
The name says is it all. Its a line that measures the slope of the trend and direction as well. The direction is shown as red for a downtrend and blue for an uptrend.
Pivot Points
Traders use pivot points to find intraday support/resistance levels. Pivot points are found by a simple calculation which involves the open, high, low and close for the previous day of any particular stock or index. It is said that when a price hovers below a pivot or pivot support/resistance and breaks up through it then its a buy signal (or vice versa for a sell signal). Or if the prices are above the pivot it is considered bullish and if they are below then bearish. The most common way to use pivot points are as reference points for entering trades if your other favorite indicators are also giving the same directional signal. Market Makers can use the pivot points to create a market by shifting the price around between levels to entice buyers or sellers of a stock into a trade. This can best be seen on low volume trading days as the prices fluctuate between the calculated points.
Many variations exist for calculating the pivot point and its related support and resistance levels. The Traditional Method:
* Pivot point = (H + L + C)/3
* First support = (2 * Pivot) H
* First resistance = (2 * Pivot) L
* Second support = Pivot (H L)
* Second resistance = Pivot + (H L)
In our system we mainly use pivots for exits. You don't need to know these calculations as they are automatically calculated in the software, its more just for informational purposes.
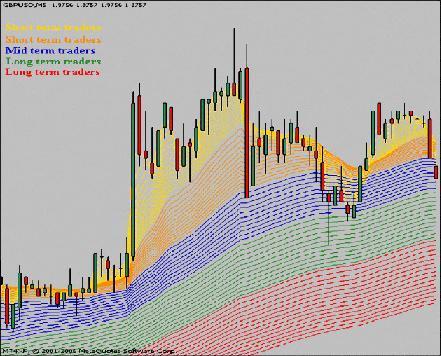
Guppy Multiple Moving Averages GMMA
The Guppy MMA is a combination of moving averages and is optimized to allow for smoother and more accurate moving averages that are not easily spiked by sudden market movements.
The biggest fallacy of basic moving average crossover systems is that they can and will be very choppy when markets are not trending. At the same time when using basic crossovers systems the traders have little or no idea of underlying trend. Is the trend continuing or is it about to end. The Guppy MMA will answer all this questions and will give you the reason why you entered the trade so you can improve on your trading skills.
The importance of this indicator can not be emphasized enough! You must agree with what it is that it is telling you. The original guppy method was created by Darryl Guppy and is called the guppy. The original consists of 3,5,8,10,12 and 15 EMA for the short term moving averages (traders) and 30,35,40,45,50 and 60 EMA long term moving averages (investors).
The time frame is not important with this indicator, in the Trend Follower system we use it in 5 minute markets, but it can be used anywhere from 1m to monthly charts. It is just as accurate in any time frame. In our modified guppy we use 5 different colors for each different type of trader. When you are trading it is important that you know the underlying trend, hence you have to know what other traders are doing. Using the colors you are able to tell what other market participants are up to and as such make better trading decisions.
1. Yellow - short term traders (Mainly going for quick pips and not interested in holding positions)
2. Orange - short term traders (Those hold on the positions a little longer than the yellow)
3. Blue - mid term traders (Mainly swing traders, usually hold on the positions longer than previous 2)
4. Green - long term traders (Will hold on to their positions longer than mid and short term traders)
5. Red - long term traders or investors (They hold on to their position the longest)
The MMA reveals the relationship between short term traders and investors. Traders (yellow and orange) probe for weakness in the underlying trend and always lead the next trend or current trends. As they are going for quick profits, they are in and out of the market very quickly. Investors on the other hand are slow to move. However for a trend to succeed, the support of investors (red and green) is essential.
As a trend trader, you will be looking for situations where all the traders agree on the direction of the market (Yellow, Orange, Blue, Green & Red moving averages). If all the traders are in agreement, then that is the direction to trade. Any disagreement means you do not trade. By correct interpretation of the MMA, you will be able to identify the trend, possible trend exhaustion and also possible trend changes. Overall, you will be able to make better trading decisions.
Forex system - Trend Follower 5Min System
_________________________________________________________
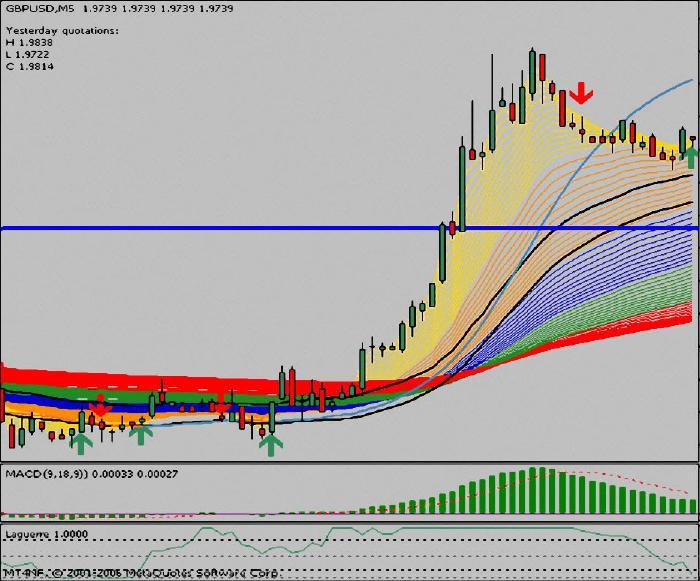
Breakouts
Though we avoid trading breakouts, the guppy MMA shows us exactly when this is happening. Once a breakout has occurred whereby the yellow lines cross the red lines but the green lines are still below the red, we would expect the yellow lines to retrace back. This is the point where we would be waiting to place our new positions in the direction of the new trend. Please note that you DO NOT place trades during a breakout but after the prices have retraced which is denoted by the green and red lines changing positions.
Long Breakout:
The red lines had been above the green lines then the yellow crossed the red lines and soon the price retraced to the other lines. The green are now above the reds and they show a long trend.
Short Breakout:
The red lines had been below the green lines. This was indicating a long trend. Then the yellow lines crossed the green and red lines. Once the green lines have been below the red lines we can say that we are in a short trend now and we can wait for signals.
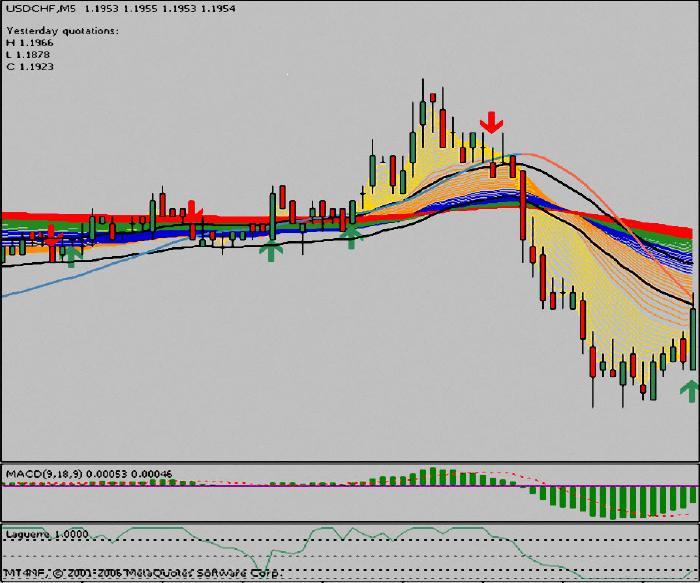
Remember the positions of GREEN lines and RED lines. For a trend to be considered long the green must be above the red lines, and for short the green lines must be below the red lines.
False Breakouts
False breakouts can be more easily identified with the Guppy MMA. This also is one of many benefits of this indicator. False breakouts can be financially and emotionally draining to a trader.
If the yellow or orange color lines cross the reds but the green lines still remain in their previous direction, then we are most likely facing a false breakout. For a trend change all lines especially the greens must change positions with the reds. You should especially be careful with volatile pairs such as GBP/USD.
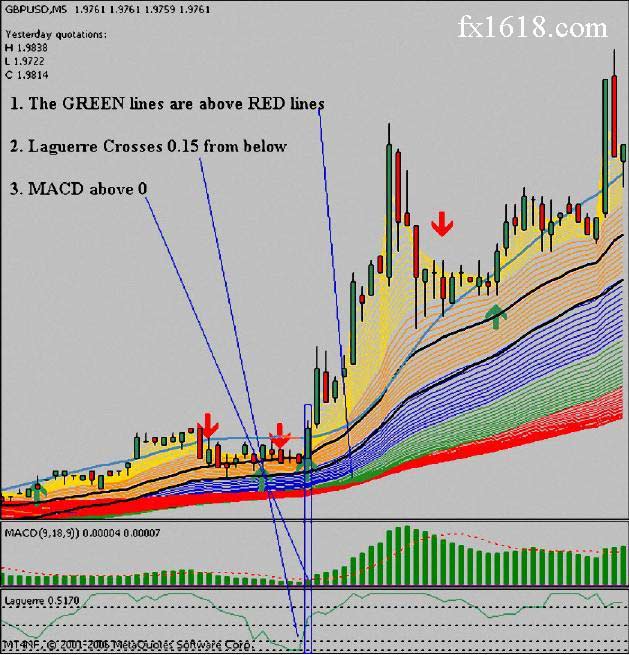
Trend Follower - The Rules
All the criteria must be met at the bar with signal or one after! If everything is not met at the signal bar or one after, leave it alone! It might eventually go the right way, but in the long term it will give more false trades. Only take trades where at the signal bar or one after all these rules apply! We enter the next bar after the signal.
Long\Buy
ENTRY: First We wait for a long signal alert
GUPPY MMA: The green lines must be above the red lines! Green, Red and Yellow lines must agree and head north. All the lines must be going in the same direction!
LAGUERRE: Laguerre line must cross the 0.15 from below and head up
MACD: This is important! When you get the signal MACD must be above 0
STOP LOSS: 5 points (+spread!) below recent LOW
ALTERNATE STOP LOSS: 20 points on default pairs and 25 point on more volatile pairs such as the GBP pairs and crosses. Choose whatever SL method fits you best
EXIT (combined): When you open a position you can then choose to close half of the position on the first pivot point and let the other half run till the slope direction line goes red
ALTERNATE EXIT: You can choose your own method and close positions at pivot points or when slope direction line goes red after a move, or when price (a new candle) opens on the other side of the volatility channel
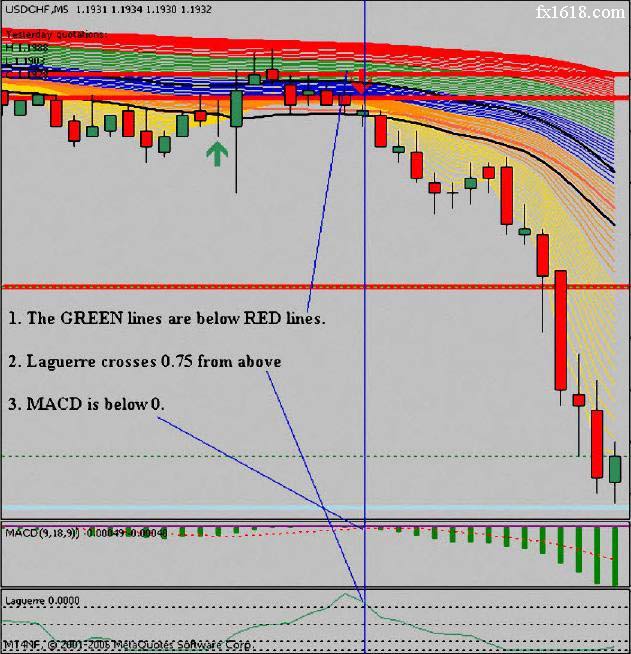
Short\Sell
ENTRY: First We wait for a short signal alert
GUPPY MMA: The green lines must be below the red lines! Green, Red and Yellow lines must agree and head south.All the lines must be going in the same direction!
LAGUERRE: Laguerre line must cross the 0.75 from above and head down
MACD: This is important! When you get the signal MACD must be below 0
STOP LOSS: 5 points (+spread!) above recent HIGH
ALTERNATE STOP LOSS: 20 points on default pairs and 25 point on more volatile pairs such as the GBP pairs and crosses. Choose whatever SL method fits you best
EXIT (combined): When you open a position you can then choose to close half of the position on the first pivot point and let the other half run till the slope direction line goes blue.
ALTERNATE EXIT: You can choose your own method and close positions at pivot points or when slope direction line goes red after a move, or when price opens on the other side of the volatility channel.

----------- EDUCATION ---------
-------TRADING METHODS ------
--------- FOR TRADERS ----------
-------------- OTHER ------------
---------------------------------------------

_________________________________________________________________________________________________________________________________________