Trading terminal allows to see on the screen as many charts as you want at the same time for different currency pairs and for different periods of time. Charts are created in real time.
In MetaTrader you can create the following types of charts:
1. Line chart.
In such type of charts axis of abscissas is for unit segment of time (minutes, hours, days, months etc.), and axis of ordinates is arithmetical. To create a chart of this type closing prices are used, i.e. the prices of the last quotations in each period (each minute, hour etc.). The resulting points are connected with straight lines. It is recommended to use such charts for short periods of time (up to several minutes). In order to change the chart type for the line one you can press the button on the «Charts» bar, use the Alt+3 key combination or the «Charts -> Line» menu.
Model of a line chart creating in MetaTrader.
2. Bar chart.
A chart, consisted of bars, each of them showing the maximum price high (upper point of the bar), minimal price low (lower point of the bar), opening price open (a little line left of the vertical bar) and closing price close (a little line right of the vertical bar) for a given period of time (for instance, for 1 hour). It is recommended to use such charts for the periods of time from 5 minutes and more. To change the charts type for a bar one you can use the button on the «Charts» bar, use the Alt+1 key combination or the «Charts -> Bars» menu.
Model of a bar chart creating in MetaTrader
3. Candlesticks.
Candlesticks are created similar to bar charts. Forecasting with the help of candlestick chart was one of the most popular methods of technical analysis in 80-90-s. This method is one of the most demonstrative and natural. Most often candlesticks are created for daily charts. This is because of the fact that it is this period of time for which this method was developed and used. The psychological background of this method of technical analysis is based on the correlation of the opening and closing prices of one and the same trading day, as well as closing prices of the previous trading day and opening prices of the next trading day. A candlestick differs from a bar by shape. Between opening and closing prices a square is drawn, which is called the candlestick body. The vertical little lines above and below the body are called shadows and show the maximum and minimal prices in this period of time, respectively. The candlestick body is colored differently depending on the relative positions of opening and closing prices. In the world practice the following method is used if a bar closed on a higher level against the opening price the white color is used, if a bar closed below the opening level the candlestick body is colored in black. In order to change the chart type for candlestick one you can use the button on the «Charts» bar, use the Alt+2 key combination or the «Charts -> Candlesticks» menu.
Model of candlestick chart creating in MetaTrader
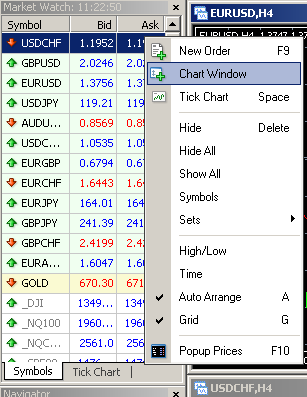
In order to create a new chart for a certain currency pair click the right mouse button on the «Market watch» window and select in the appeared context menu the «Chart window» item.
New chart creating
Using the Drag'n'Drop technology you can replace one chart to another in any open window. To do this you should seize the necessary currency pair with the help of the mouse from the «Market watch» window and holding down the left mouse button «drop» it in the chart field.
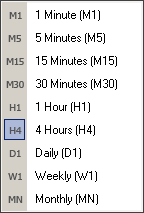
Chart periodicity is a period of time information for which is shown in a bar or a candlestick. For instance if we create a 15-minute (M15) bar chart each bar will contain the information about price dynamics within the corresponding 15 minutes.
Informational trading terminal MetaTrader gives possibility to create charts with the following time intervals: 1, 5, 15, 30 minutes (M1, M5, M15, M30 respectively), 1 hour (H1), 4 hours (H4), 1 day (D1), 1 week (W1) and 1 month (MN). In order to change the charts time period you can use the «Chart periodicity» toolbar.
The «Chart period» toolbar
Quick access to the charts settings you can get with the help of the context menu, activated by right mouse button clicking at any place on the chart.
Chart context menu
Chart
«Periodicity» activates the submenu for selecting the charts time period; This operation can be done also by pressing the button on the «Charts» toolbar;
The «Charts» toolbar
«Refresh» in case of mistakes or «gaps» on the price chart missing records from the server are downloaded and reflected in the chart;
«Grid» hide/show the grid in the chart;
«Volumes» show/hide tick volume (the number of quotes for the given period of time);
«Zoom in» / «Zoom out» enlarge or minimize the charts scale. Another way is to press the / buttons on the «Charts» toolbar or to click the «+» or «-» keys;
«Save as picture
» save the chart in the form of graphic file in gif or bmp format;
«Properties
» (hot key F8) enables the chart settings window and with the help of the «Colors» tab you can set the color for different charts elements.
The «Colors» tab of the charts properties window
The «General» tab of the charts properties window
Most settings in the «General» tab speak for themselves.
We will describe only several items that can be difficult to understand.
«Autonomous chart» this option stops receiving and reflecting quotations for the given chart. Once the chart is open offline (the «File -> Open autonomously») the option activates automatically;
«Chart shift» allows/prohibits to shift the chart from the right edge of the window. Another way is to press the button of the «Charts» toolbar or with the help of the«Charts -> Chart shift» menu;
«Auto scroll» enable/disable the function to scroll the chart automatically to the left once the new tick come. Another way is to press the button of the «Charts» toolbar or to use the «Charts -> Auto scroll» menu.
Types of charts and ways of their creating in MT4
_________________________________________________________
See more about MT4:
Types of charts and ways of their creating in MetaTrader
Related Topics:

----------- EDUCATION --------
-----TRADING METHODS -------
--------- FOR TRADERS --------
------------ OTHER -------------


_________________________________________________________________________________________________________________________________________