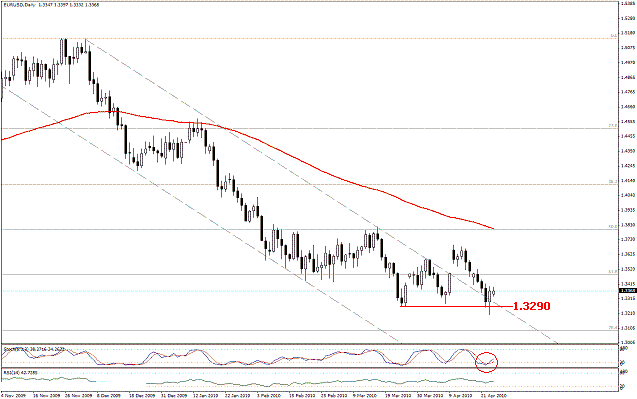
EURO
The pair is still trading above the resistance for the previously breached main descending channel that is currently forming a support at 1.3290. Momentum indicators are showing positive signs, where the pair is expected to head upwards throughout this week's trading. Meanwhile, the ongoing negative pressure that the pair saw last week makes us recommend following up on the daily reports awaiting more confirmation. The breach of 1.3390 to the upside will pave the way for the expected bullish direction; whereas the breach of 1.3290 will add more negative pressure on the pair.
The trading range for this week is among the key support at 1.3090 and the key resistance at 1.3685.
The short term trend is to the downside as far as 1.4410 remains intact with targets at 1.2450.
Support 1.3290 1.3265 1.3190 1.3115 1.3090
--------------------------------------------------------------------------------
Resistance 1.3385 1.3445 1.3495 1.3570 1.3635
--------------------------------------------------------------------------------
Recommendation Based on the charts and explanations above we recommend following up on the daily reports awaiting more confirmations
-----------------------------------------
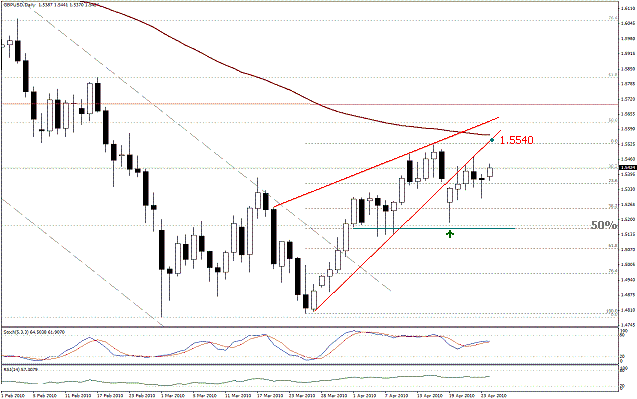
GBP
The pair settled for the 50% Fibonacci correction shown above as targets for the bearish technical pattern shown in our previous reports. This makes us expect a bullish direction for this week that will start with the breach of 1.5540 heading towards 1.5700 then 1.5810. This scenario requires 1.5185 to remain intact.
The trading range for this week is among the key support at 1.5185 and the key resistance at 1.5700.
The short term trend is to the upside as far as 1.4850 remains intact with targets at 1.7000.
Support 1.5355 1.5280 1.5255 1.5185 1.5125
--------------------------------------------------------------------------------
Resistance 1.5450 1.5475 1.5500 1.5540 1.5605
--------------------------------------------------------------------------------
Recommendation Based on the charts and explanations above our opinion is buying the pair with the breach of 1.5450 targeting 1.5615 and stop loss below 1.5335, might be appropriate
-----------------------------------------
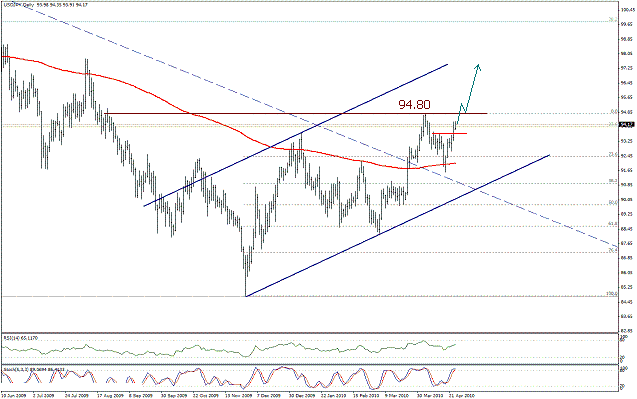
JPY
The breach of the bullish technical pattern was confirmed last Friday, where its targets are around 95.15. Achieving the mentioned target will put the pair above the pivotal resistance shown above, where this will complete the formation a bullish technical pattern that will help achieve further upside movement expected for this week. Technical targets reside at 98.00 and require the daily closing to remain above 93.30.
The trading range for this week is among the key support at 92.65 and the key resistance at 97.90.
The short term trend is to the downside as far as 101.65 remains intact with targets at 82.60.
Support 94.00 93.30 92.60 92.25 91.60
--------------------------------------------------------------------------------
Resistance 93.40 93.70 94.00 94.70 95.55
--------------------------------------------------------------------------------
Recommendation Based on the charts and explanations above our opinion is buying the pair with the breach of 94.80 target 96.65 and stop loss below 94.00, might be appropriate
-----------------------------------------
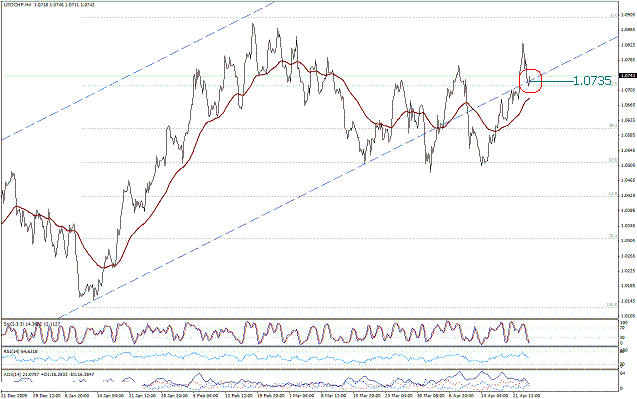
CHF
We still havent attained confirmations for returning within the previously breached ascending channel, inline with conflicting technical signals that will add more volatility and fluctuations for confirming the pair's trend; where the pair is currently holding at 1.0735 support. from here, we recommend following up on the daily reports for more confirmations over the coming direction for the pair.
The trading range for this week is among the key support at 1.0540 and the key resistance at 1.0945.
The short term trend is to the downside as far as 1.1095 remains intact with targets at 0.9910.
Support 1.0735 1.0670 1.0605 1.0565 1.0505
--------------------------------------------------------------------------------
Resistance 1.0840 1.0895 1.0945 1.1000 1.1050
--------------------------------------------------------------------------------
Recommendation Based on the charts and explanations above we recommend following up on the daily reports awaiting more confirmations
-----------------------------------------
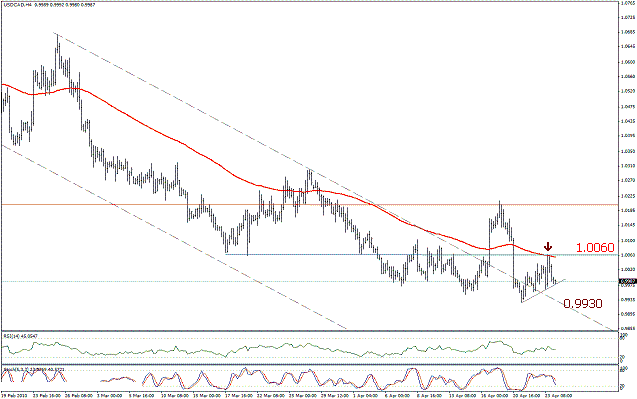
CAD
The last bullish wave for the pair halted at 1.0060 affected by the strength of the re-test level, as well as 100 MA that has formed strong resistance in front of the pair. The minor support level is currently carrying the pair, but we expect the pair to breach this level at 0.9985 which will pave the way for the expected bearish direction this week; the move requires the breach of 0.9930 and trading to remain below 1.0060 to prevail. The awaited technical targets start at 0.9705.
The trading range for this week is among the key support at 0.9705 and the key resistance at 1.0200.
The short term trend is to the downside as far as 1.0780 remains intact with targets at 0.9705.
Support 0.9985 0.9930 0.9865 0.9805 0.9750
--------------------------------------------------------------------------------
Resistance 1.0060 1.0140 1.0200 1.0240 1.0320
--------------------------------------------------------------------------------
Recommendation Based on the charts and explanations above our opinion is selling the pair with the breach of 0.9930 targeting 0.9750 and stop loss above 1.0060, might be appropriate.

_________________________________________________________________________________________________________________________________________
Related Topics

----------- EDUCATION ---------
-------TRADING METHODS ------
--------- FOR TRADERS ----------
-------------- OTHER ------------
Forex - Weekly Technical Analysis (26.42.5)
_________________________________________________________