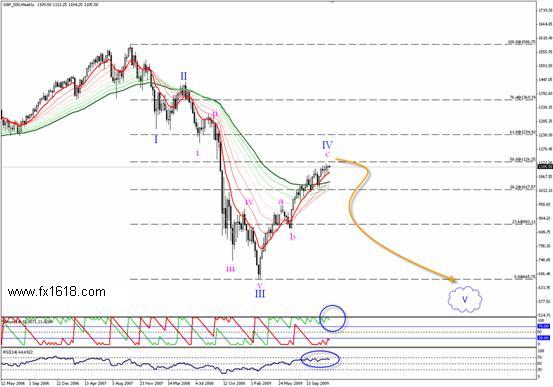
Since placing the medium term top at 1585.00 zones, we can see how the index succeeded in forming 3 waves already and it's presently forming the grand 4th wave.
S&P500 Index - Annual Technical Analysis for 2010
_________________________________________________________
The above weekly chart shows this suggested Elliott count scenario. The S&P 500 is facing the 50% Fibonacci level for the entire aforesaid collapse, which is valued at 1235.00; we believe that it's on the way to start aggressive downside actions, consisting of 5 waves to form the bigger fifth wave and to complete the [IM] wave, retargeting 665.00 areas.
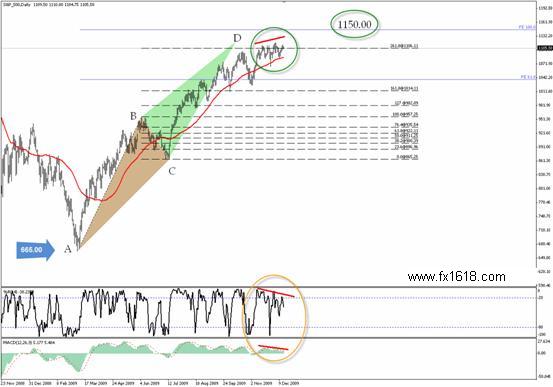
We all know that the corrective wave usually consists of 3 waves, and thats exactly what happened since bottoming out at 665.00 levels; we see those 3 waves from a harmonic point of view, as seen on the daily chart below for the same suggested corrective wave, which shows that the index has formed a bearish harmonic [AB=CD] pattern.


------------ EDUCATION -----------
-----TRADING METHODS ------
--------- FOR TRADERS --------
------------ OTHER -------------
This harmonic pattern seeks a completion around the cluster resistance area which consists of:
A) 50% Fibonacci level for the entire drop from 1585.00 as we mentioned above.
B) 261.8% Fibonacci projection level for the proposed BC leg at 1106.00 zones.
C) The full correctional level (100%) of Fibonacci expansion for the ABC at 1150.00 zones.
Thus, we see that this harmonic scenario in addition to the slant negative divergence on MACD indicator adds further confirmation for the bearish speculation over short term basis, targeting the pivotal support level of 960.00 zones. William % R indicator also shows that the index is definitely overbought, supporting our negative overview.
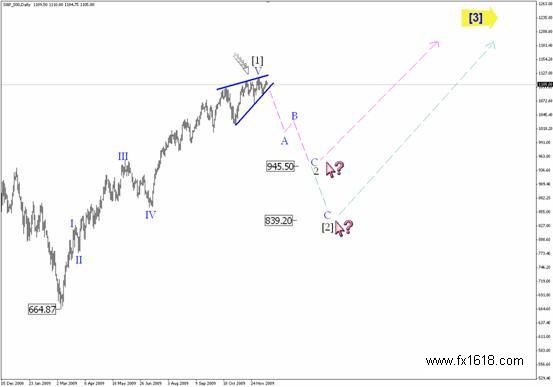
Actually, there is another daily bullish scenario that might be able to damage this outlook completely and we will discuss it together on the chart below.
It shows the probability of forming an IM wave form the recorded low at 665.00 zones. Henceforth, the structure might be seen as impulsive followed by a corrective [A-B-C] in order to form the grand 2nd wave, targeting 960.00-945.00 zones, and might extend further towards 840.00, then followed by a bullish resumption to resume the entire [IM] which consists of 5 waves . Consequently, the grand 3rd is to start from the above mentioned levels.
Nevertheless, in both cases, pullbacks are awaited over short term basis towards 960.00.
Therefore, a break of 1370.00 will support the bullish overview and will make us reconsider the first suggested weekly bearish scenario.
Related Topics

_________________________________________________________________________________________________________________________________________