The pair has moved bullishly since March 2009, and succeeded in placing a temporarily high on the November 21, 2009.
There is a possibility that the pair is forming an IM wave despite the confliction among analysts, as some see that it's a ZZ wave.
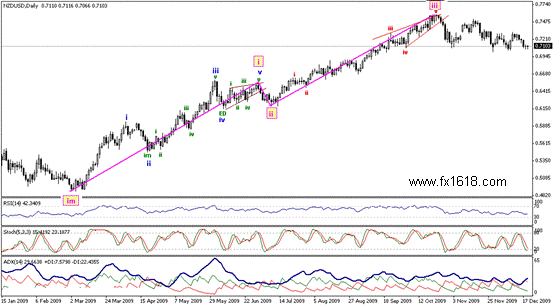
We are now about to explain the IM scenario which is accepted as far as 0.6570 areas remain intact.
NZDUSD - Annual Technical Analysis for 2010
_________________________________________________________
The above chart makes us believe that the wave that has been formed in 2009 is an IM. We see how the suggested third wave was in progress with mild and short corrective actions which was seen as the third wave, where the second itself corrected to 23.6% Fibonacci level, followed by sharp inclines.
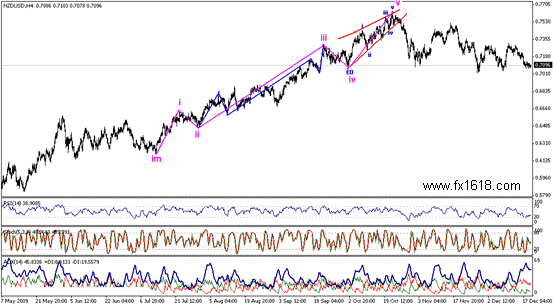
It was very hard to define the internal formation of the above wave on the daily chart. That's why we started to study the four-hour interval as seen on the image below.


------------ EDUCATION -----------
-----TRADING METHODS ------
--------- FOR TRADERS --------
------------ OTHER -------------
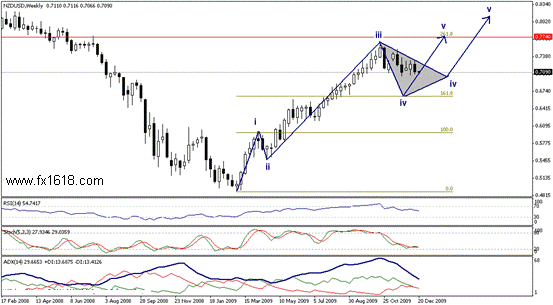
Consequently, we think that Kiwi is forming the 4th wave and is to be followed by another incline, targeting 0.7740 zones.
A break of these levels will open the door up for additional bullishness which might target the recorded peak of 2008 around 0.8200 zones.
This negative scenario will be valid as far as the pair fails in maintaining steady levels above 0.7400 zones
This highly anticipated bullish action is to form the grand fifth wave as seen on the above image.
The mentioned targets are to be witnessed over short term basis if the wave is IM.
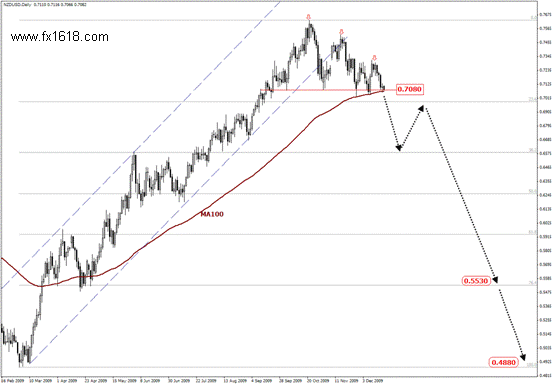
Now, we can't ignore another potential bearish scenario that has been suggested by another team of our analysts, and it might be activated if the pair couldn't maintain levels above 0.7400 zones.
This scenario depends on the breakout below the lower line of the bullish channel which organized the movement that started since the beginning of 2009.
This breakout occurred below the support level of 0.7250. The reversal classical pattern, seen on the daily image below, with the neckline at 0.7080 adds further confirmation for our captured breakout.
As a result, the pair is negatively pressured to start a new downside wave, targeting 0.6585 followed by a mild bullish correction, then resuming the bearish direction, targeting 0.5530 followed by 0.4880 zones.
Related Topics

_________________________________________________________________________________________________________________________________________