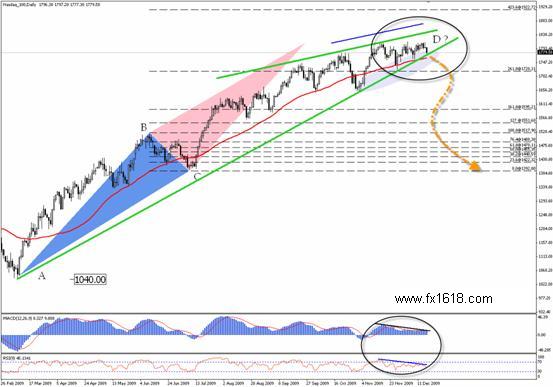
Looking at the daily chart, we will discover that Nasdaq 100 has been capable of forming a bearish harmonic AB=CD pattern, seen on the chart below.
NASDAQ 100 Index - Annual Technical Analysis for 2010
_________________________________________________________
Since bottoming out at 1040.00 zones on March 09, 2009, the index started obvious ascending movements which created an uptrend line -colored in green-.
Actually, the aforesaid bullishness which started with the 2nd quarter of 2009 is to be seen as correctional movements for the entire drop from 2255.00 zones to the recorded low of 1017.00.
Thus, the question that jumps into mind is what will the next big move be? Will it resume the major bearish direction or will it continue building the recently established bullish movement?
The harmonic formation which we mentioned in the 1st paragraph might be capable of providing the answers.
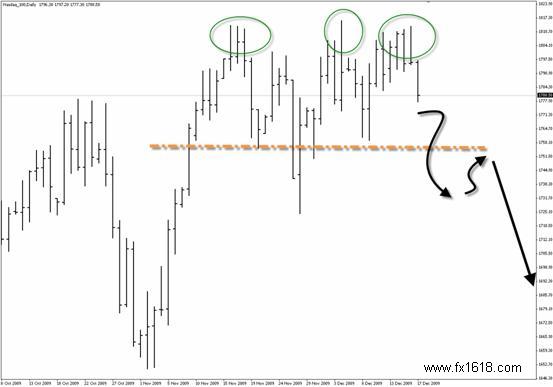
Despite breaching 261.8% Fibonacci level of the BC leg, the same daily chart below offers a potential classical pattern [Triple Top] that represent a reversal sign itself. We can't leave this point without noticing the heavy negative divergence which formed clearly on MACD and RSI 14 indicators.
To conclude, we believe that this classical pattern might fill the role as a replacement for the extended Fibonacci level of 261.8%, and probably will force the index to move downwards.


------------ EDUCATION -----------
-----TRADING METHODS ------
--------- FOR TRADERS --------
------------ OTHER -------------
The confirmation for this scenario will be obtained once it could hit the uptrend line along with breaching SMA 50 -colored in red-. If that occurred, then the way will be paved for retargeting 1552.00 areas; a break of which will cause a panic selloff towards 1390.00 and might extend further towards the full correctional level of 1017.00.
Thereby, the medium term outlook is bearish and this technical point of view is highly favored from our technical team.
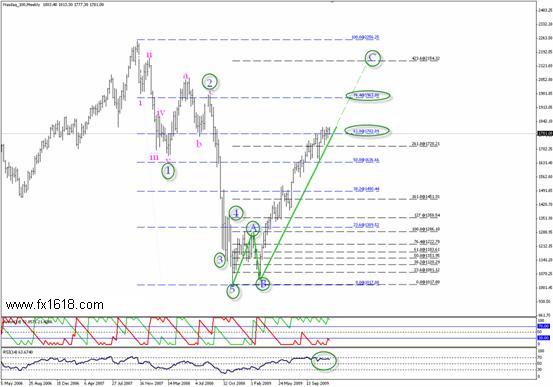
On the other hand, there is another scenario which may damage this overview completely, seen obviously on the weekly chart below.
The chart offers an Elliott cycle, starting from the recorded peak of 2256.00, where it succeeded in constructing an [IM] impulsive downside wave already followed by 2 corrective waves [A and B].
As a result, the index is presently forming the grand [C] wave to complete the sequence, shall 76.4% Fibonacci level at 1965.00 zones allow it to form an extended wave, reaching 2155.00 areas.
Rationally, we have to watch out the behavior carefully around the critical current level of 61.8% Fibonacci level first to speculate if it will reach 76.4% level or not.
This will make us focus back into our above discussed bearish harmonic and classical scenarios.
Henceforth, a decisive breakout accompanied by a stable move above 1820.00 first followed by the most sensitive level of 1965.00 -which represents the turning point- are needed to confirm that the abovementioned Elliott count is correct and that we should eye northern targets.
Related Topics

_________________________________________________________________________________________________________________________________________