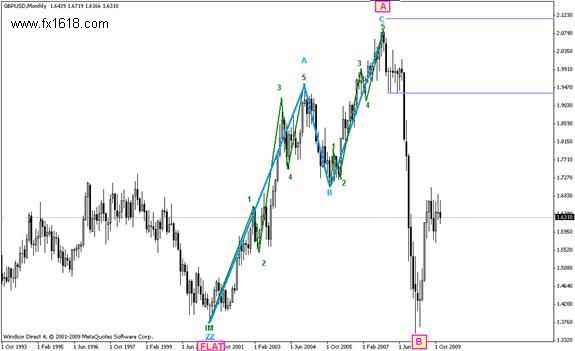
Since June 2001, Sterling versus the dollar entered a new pattern which formed a Flat wave, where waves A and B were completed of this pattern; conflicting ideas are seen in the pair?s studies especially over wave B as it was very steep and that pressured some analysts to think it was an IM wave, yet actually it was closer to being a steep Zigzag wave. The ZZ wave is characterized by the steep direction which it might take in some time and that is what the pair indeed witnessed during wave B from this pattern in the period from November 2007 till January 2009.
GBPUSD - Annual Technical Analysis for 2010
_________________________________________________________
The flat wave is structured from three internal wave with a 3-3-5 count, meaning that wave A and wave B are likely to take a number of forms like a Zigzag ZZ or a Double Zigzag DZ or even a Triple Zigzag TZ; while wave B had more possibilities, yet as we assess the pair we can clearly see that it was a ZZ wave and the DZ scenario is also acceptable as all does not contradict with what we are going to go be discussing after.
Before discussing the details for the pair to be trading within a Flat Wave, we should note that there is a possibility for the pair to be trading within a D3 Wave, yet the indications on the chart support the likelihood for the Flat Wave; that is what we are going to depend on and thereby we are now in the last wave that forms the C of the proposed scenario.


------------ EDUCATION -----------
-----TRADING METHODS ------
--------- FOR TRADERS --------
------------ OTHER -------------
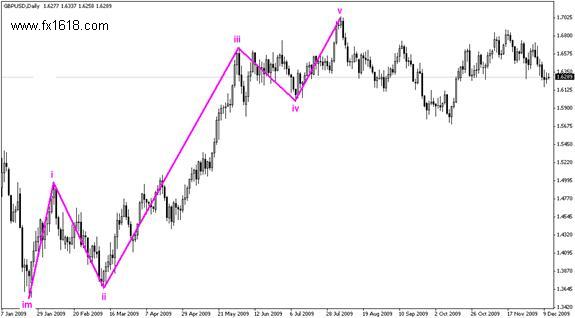
The wave C of the flat wave scenario has taken the form of an IM wave or a LD or an ED wave, noting that in most cases this wav is usually and impulsive wave. Looking at the upside wave which started in November 2009 we can see that it has taken the form of a perfect IM wave, yet this wave did not correction the required length of wave C and therefore we consider the IM wave shown on the chart as the first of five waves.
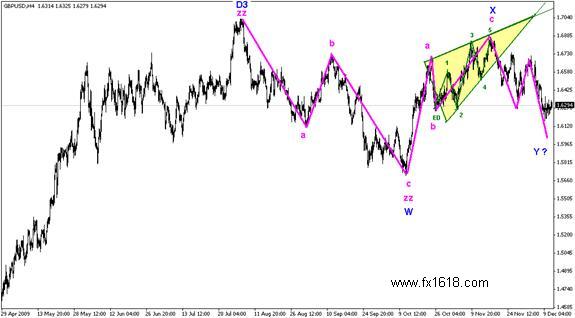
The current problem is assessing the type of the second correction wave which started on August 05, 2008 and this correction wave forms the second of the five waves suggested in the Impulsive C wave. There are a number of possibilities to explain this wave, yet we used the upside X wave to define its type and the wave included an ED wave ?shown in the yellow area- this shows the possibility that wave X will be in the form of a Zigzag wave.
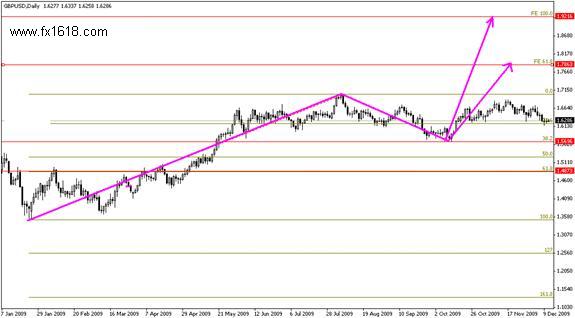
From here, we expect that the general outlook for 2010 trading is to be to the upside and consolidation above 1.5700 will confirm the upside wave and initially the pair will target 1.7915 at least estimation and this level represents the 61.8% extension for the first IM wave and we detailed the proposed scenario on the provided chart above. We should note that the general upside trend for 2010 remains valid as far as 1.4870 is intact yet we prefer depending on 1.5700 to define the direction.
If 1.5700 was breached and steady trading was set below that level, we should assess the pair according to classic analysis which completely opposes the aforesaid expectations. Some analysts have indeed expected the breach of the 1.5700 during 2010; therefore, we also covered the possibility of such a breach to the pivotal support for 2010 trading.
Over daily basis, we can see that a bearish pattern is currently construction, in the form of a Double Top patter, where the pair is currently halfway from setting the second top; the neckline for this proposed pattern is at 1.5750 and breaching this level with a daily closing will ignite a strong downside move targeting initially 1.4950 -61.8% correction for the entire upside wave from 1.3653 to 1.7041- followed by further bearish moves towards 1.4455.
We have reached to the fact that the pair is currently looking for the area to start its new upside direction, which is to be strong and long wave which is to extend over a lengthily period of time which will take the form of an Impulsive wave IM. Yet, for starters, the current downside should bottom out ending the D3 pattern, and the possibilities for this wave are many, while the most important proposed bottom areas are between 1.6155 and the support at 1.5700, where the latter is the bottom for W wave shown above accompanied with the 38.2% correction of the previous IM wave.
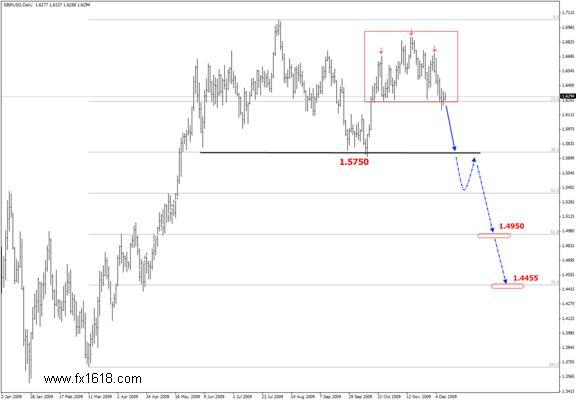
Completing the second top for the pattern is a proposed scenario, yet it?s supported by the formation of a secondary Head & Shoulders pattern, located in the red box on the chart above; a series of daily closings around the neckline for the secondary pattern at 1.6250, and therefore we expect continued pressure on this level attempting a breach that will surely pressure the pair to the downside, and by that completing the main bearish Double Top pattern which will be capable of reversing the medium term trend to the downside.
Related Topics

_________________________________________________________________________________________________________________________________________