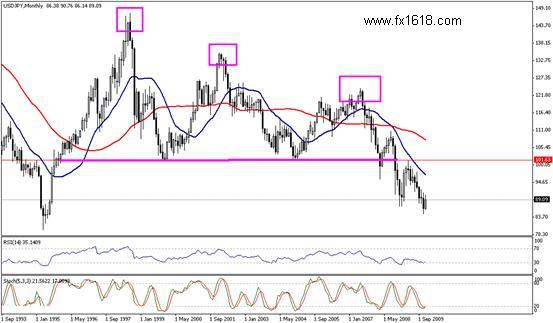
On the monthly chart provided, we can see that during 2009 the pair inclined strongly to set its highest at 101.43 and then entered a bearish wave that led it towards 84.79, yet in December the pair returned to trade around the year's opening levels ending the year in nearly sideways trading.
What mostly caught the eye in 2009 was that trading was in general above opening levels at 90.67, yet the rise was fast before the pair reversed to the downside in a contentious motion since April that took it to the lowest set at 84.79.
USDJPY - Annual Technical Analysis for 2010
_________________________________________________________
On the chart above, we can see that the pair inclined to retest the neckline for a classic bearish pattern, where the proposed neckline resides around 101 areas from where the pair head to the downside. Momentum indicators are currently reflecting oversold signals and possibility for upside reversal, yet at the same time we can see that the pair's formation is still bearish and any trading below 101.00 will keep the downside wave valid.


------------ EDUCATION -----------
-----TRADING METHODS ------
--------- FOR TRADERS --------
------------ OTHER -------------
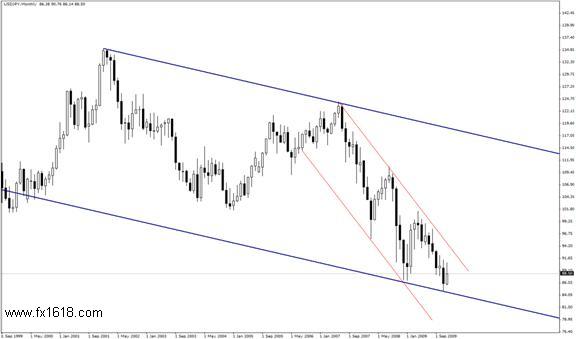
The second chart shows that 2009 trading was within the descending channel that started on June 17, 2007 from areas slightly above 124.00; the major resistance level for the downside wave now resides at 94.00 - 95.00 while we can see that the 38.2% correction at 99.90 protects the downside move, and for that any volatility and fluctuation below 95.00 will keep the downside wave valid and 99.90 will keep the general trend to the downside. In 2009, the 20 & 50 Weekly MA formation has not changed as is still intact pointing to the downside as we enter 2010.
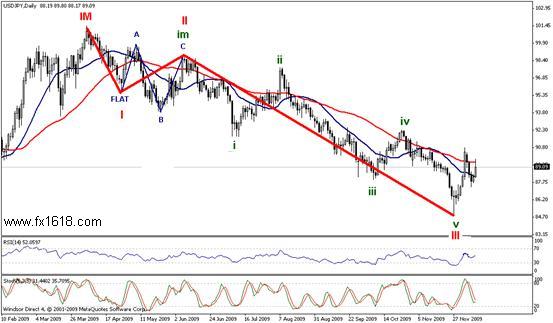
According to Elliot theory, the best scenario possible of the pair is the one presented on the chart above. Opinions varied over the numbering of the IM wave above, and the confliction was mainly over the second wave, yet we see that the second wave was a Flat unstructured wave, and by dealing with the pair in that manner, we can see that the first three waves were completed from the top at 101.43 to the bottom at 84.79, and till this minute there is no numbering that fulfils the classical Elliot numbering but this scenario (the crossing of the fourth with the second within the higher ranking IM third wan was taken into consideration; while taking the analysis after applying standard deviation on the pair it did not complete the crossing). From here we can see that the pair has started the fourth wave which might take the form of a ZZ, DZ or TZ, as the second was a sideways wave and for that the fourth is expected to be very steep.
The probable ending for the fourth wave is the 50% at 91.85 or 93.45 where reaching 95.52 does not interfere with the classical Elliot theory, yet this level is unlikely but possible.
Therefore, we see that the general trend should include a strong bearish move that will take the pair below the previous bottom set at 84.79 and might extend toward 81.90 and then 78.05. We might see a strong direction reversal after the expected decline, yet at the same time we cannot expect a the pairs reversal before the completion of the bearish fifth wave which is the one to set lows below the recorded bottoms mentioned hereinabove, as this is what usually happens.
Despite that the majority of opinions agree on the proposed scenario, yet other analysts scenario might be activated once the pair settled above 101.65 with consecutive closings. Where in case that took place, the analysis is to be as follows:
The downside channel shown in red- was capable of leading the pair for the bearish channels resistance to its support levels, as clearly seen on the daily chart below; the pair touched the support level at 84.89 from where the pair is believed to move in what is expected a reversal to the medium term downside trend heading towards the major resistance level for the channel, and thereby the targets are among 111.00 and 114.00.
Tracking Fibonacci extensions for the pair; we can see that its trading in very complex waves that are targeting areas among 81.90 and 78.05 and any trading below 95.72 will keep the downside trading valid for 2010. The 95.00 area is very critical in 2010 and from here we see that the downside trading will generally control the years trading. We might witness upside corrections alongside heightened volatility yet all in all trading below 95.00 will keep the bearish wave valid while the long term outlook is also bearish as far as trading is steady below 101.60.
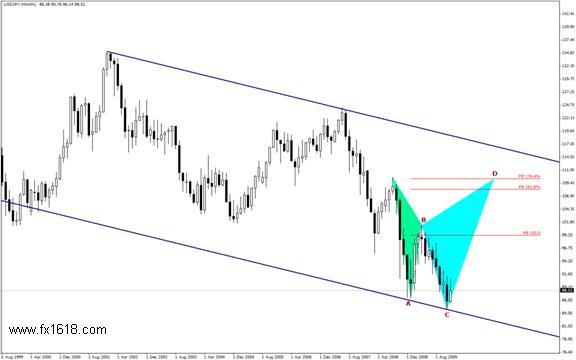
On the other hand, this upside move is expected to complete the CD leg for the proposed harmonic pattern over the medium term. The D level targets are among 108.15 and 110.30 and that supports the upside expectations for 2010. The targets start from 108.15 then 110.30 and far ahead towards the bearish channel's resistance at 114.00.
Related Topics

_________________________________________________________________________________________________________________________________________