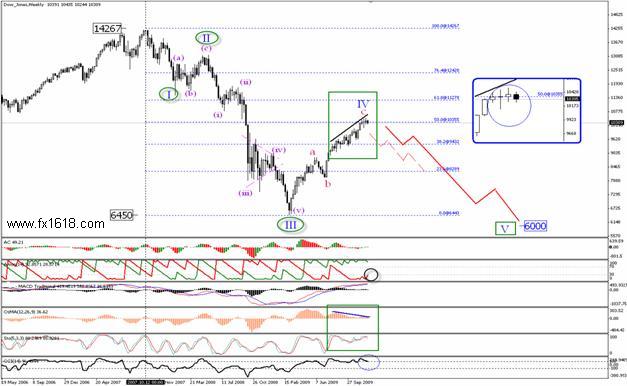
Since setting the top back in October 2007 at 14270 areas, the Dow Jones Industrial Average (DJIA) has started an obvious impulsive wave for a medium term Elliott cycle as seen on the provided weekly chart -image No. 1-.
DJIA Index - Annual Technical Analysis for 2010
_________________________________________________________
According to this suggested count, we believe that the recorded low of 6450.00 in March 2009 represents the level where the typical third wave has been placed.
Consequently, the inclines from this low towards present levels are to be seen as corrective movements. As these aforesaid actions already consisted of 3 internal waves [a-b-c], where we think that it represent the grand 4th wave of our captured weekly cycle.
The alternation role which controls the construction of the second wave and the 4th wave -common case- has occurred ideally on the chart; as we can see that the 2nd was short and sharp while the suggested 4th took a long time and long distance. Thereby, the fifth wave is urgently needed in order to resume the entire impulsive wave.
While the index is facing 50% Fibonacci level -valued at 10355.00-, which is seen as a weak level, but if very strong reversal signs appeared alongside this level, it might turn into a very strong level.
Let's examine together if there are reversal signs or not for the time being, to ensure that the top of all these corrective actions has been already placed.
Simply, the candlesticks structure, shown clearly on secondary image is very negative, while at the same time, a negative divergence has been formed on OsMA indicator. Concerning momentum indicators, we can see 2 strong bearish signs on Stochastic and CCI indicators, adding strength to 50% Fibonacci level. AROON down -colored in red- is presently attacking the value of 30.00 for the first time since July 2009, reflecting a rise in bearish strength.
To conclude, we think that the index is to start the fifth wave. Henceforth, we should talk about the possible technical targets for this wave.
Targets for wave 5:
It could have the same relationship to wave 3 or it could travel 61.8% of the net length of wave 1 and 3 together. If wave 5 is the extended wave, it mostly will be 161.8% of wave 3 or 161.8% of the net length of wave 1 and 3 together.
Therefore, we think that the index is to move sharply downwards over the medium term, retargeting 6450.00 zones and might extend further towards areas of 6000.00.
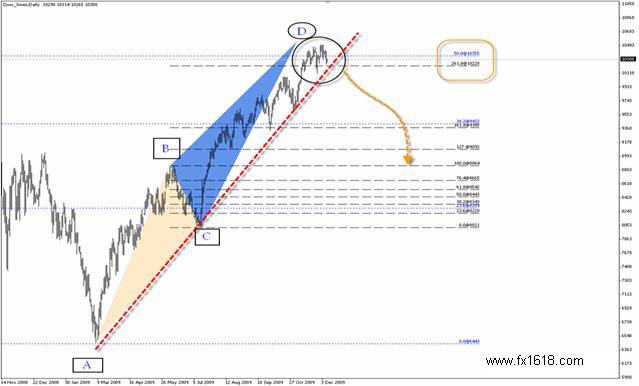
From a harmonic point of view, we see how our captured corrective wave has been capable of forming a bearish harmonic AB=CD pattern. A breakout below the harmonic uptrend line will pave the way towards 8900.00 zones while a breakout below 8000.00 zones will confirm the overall bearish anticipation.


------------ EDUCATION -----------
-----TRADING METHODS ------
--------- FOR TRADERS --------
------------ OTHER -------------
The above discussed scenario is the projection supported by the majority of our technical team, but on the other hand, some of our team believe that the Fibonacci level of 50% is not that strong to prevent the index from preceding the recently established bullishness and it might reach 11280.00 -61.8% Fibonacci level- followed by 12420.00. A stable move above 12420.00 -76.4% Fibonacci level- will be able to change the count and will indicate that the cycle might have been completed earlier around 6450.00 zones and thus the outlook might be changed from bearish to bullish.
Related Topics

_________________________________________________________________________________________________________________________________________