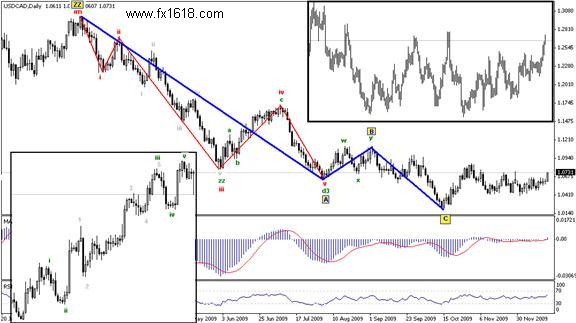
During 2009, the dollar declined noticeably against the Canadian dollar and we can see that the pair managed this year to complete the Zigzag Wave ZZ which was originally expected to be a higher formation, a Double Zigzag wave DZ
USDCAD - Annual Technical Analysis for 2010
_________________________________________________________
On the chart above, we can see that the pair managed to complete the ZZ wave and since the completion of the C wave, the pair started building an IM wave which was actually completed as seen on the chart to the secondary bottom image above; we can see that after the completion of the IM wave, the pair entered a complex sideways correction and the upper secondary chart details the aforesaid correction.


------------ EDUCATION -----------
-----TRADING METHODS ------
--------- FOR TRADERS --------
------------ OTHER -------------
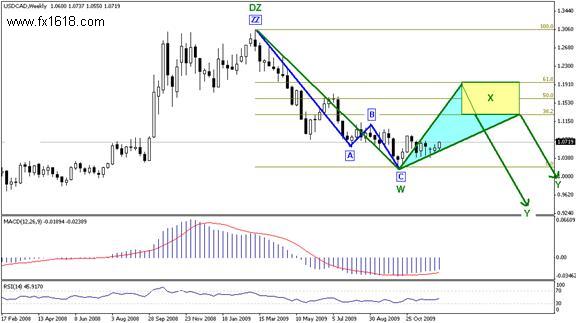
From here, we see that the first coming move expected for the pair is to the upside, yet at the same time, as soon as the pair confirms the end of wave X, it will start to head steeply to the downside one again to form the Y wave, which usually takes the form of a ZZ wave, to acquire its targets that start from 0.9835 then 0.9500 yet we might see historic records at 0.8735 in the coming period.
Therefore, we see that the start is to be with an upside correctional wave that might extend from a month to three (likely to be over two months according to Fibonacci time series) and then a strong downside wave will start over the medium and long term which will take the pair to extended low levels.
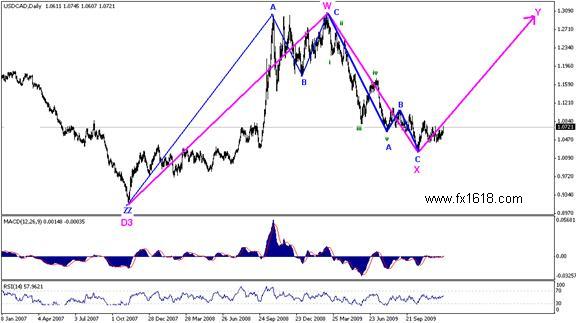
We can't ignore the other scenario proposed by some analysts, which will be acquired once the pair stabilizes above 1.1865; where if the pair managed to consolidate above this level, then we move to the second scenario for the pair which suggests reaching areas near the previous top recorded around 1.3061. This scenario was proposed on expectations that the pair might be trading within a D3 wave and in that case, as detailed on the chart below, the pair might decline slightly to retest the bottom around 1.0325 and then enter and upside wave that might lead the pair towards 1.3061 and the chart below details the expectations
Related Topics

_________________________________________________________________________________________________________________________________________