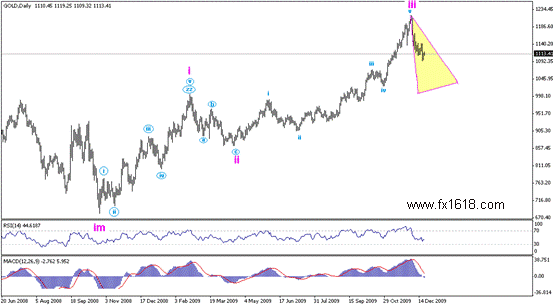
Since October 2008, gold inclined aggressively towards the recorded high in December 2009. These inclines have been followed by a sharp and fast drop, which forced many traders to forget that despite its fast and steep move, it still can't be compared to the earlier upside movements.
Let's have a look at the discussed bullishness, which is to be considered as an obvious IM Impulsive Wave-.
GOLD - Annual Technical Analysis for 2010
_________________________________________________________
On The above chart, we can see the completion of the first 3 waves, while the metal is presently forming the 4th wave within the allover ascending IM wave.
Technical targets for this suggested 4th wave reside around $990.00 per ounce, as an extreme target, but we see that it might be limited between 1085.00 and 1028.00 zones, before staring a new upside wave.


------------ EDUCATION -----------
-----TRADING METHODS ------
--------- FOR TRADERS --------
------------ OTHER -------------
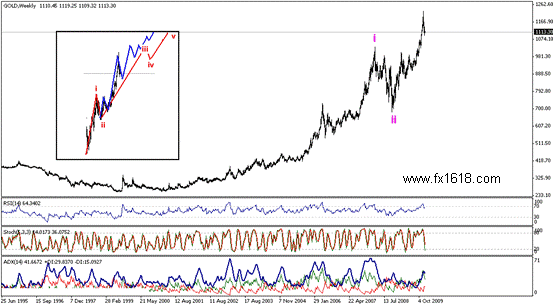
The weekly chart shows that the metal is moving inside a long term IM wave, which we will not discuss in details as our aim is to speculate the direction and movement expected in 2010.
The chart explains that gold is presently forming the grand third wave from the IM formation which originally consists of 5 waves.
Over the long term basis, sometimes the first wave takes a long time, and we can see that it started back in 1999 and was completed in March 2008, followed by the second which started with the completion of the aforesaid first and was completed in October 2008. Thus, we are moving within the grand third.
As we explained in the first chart, gold is currently trading inside the internal 4th of the third.
The metal is targeting extreme levels over long term basis, but we can define 2010 targets via Fibonacci retracements and expansions levels.
The expected targets after the bottoming of the current bearish wave reside around 1247.00 zones and might extend further towards 1329.00 areas.
This expected bullishness is to start after the completion of the current corrective wave as we discussed above. To recap, it's awaited to start from 990.00 areas if the metal succeeded in reaching those areas.
As far as $960.00 per ounce remains intact, we will keep our outlook to the upside in the coming year. A break of 960.00 will take us in a southern trip towards 820.00 invalidating by that this proposed scenario.
Related Topics

_________________________________________________________________________________________________________________________________________