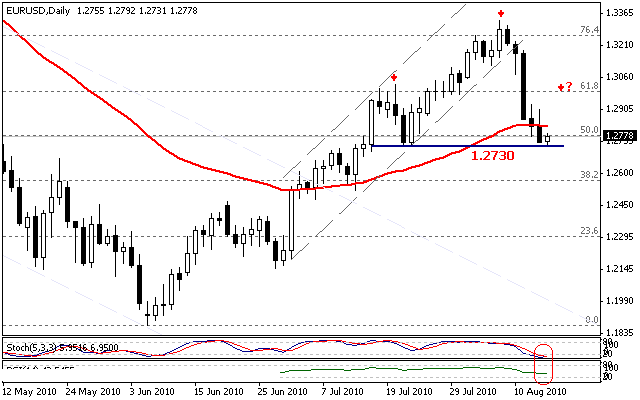
EURO
The pair succeeded at achieving a sharp descend, where it has halted at pivotal support 1.2730 that represents the suggested neckline for the bearish technical pattern, which could help resume more bearish movement on the short run. However, before we can expect a bullish correction to dominate the pairs trading, which may reach levels around 1.2900, supported by clear oversold signs appearing on momentum indicators. In overall, we expect a bearish direction for this week that will initially start with the breach of 1.2730 to head towards 1.2470 as the primary target. Keep in mind that the breach of 1.2950 and building a base above it will weaken chances of achieving this scenario.
The trading range for today is among the key support at 1.2470 and the key resistance at 1.3000.
The short term trend is to the downside as far as 1.3770 remains intact with targets at 1.1700.
Support 1.2730 1.2670 1.2600 1.2570 1.2515
--------------------------------------------------------------------------------
Resistance 1.2840 1.2880 1.2945 1.3000 1.3090
--------------------------------------------------------------------------------
Recommendation Based on the charts and explanations above our opinion is selling the pair with the breach of 1.2730 targeting 1.2570 and stop loss above 1.2840, might be appropriate.
-----------------------------------------
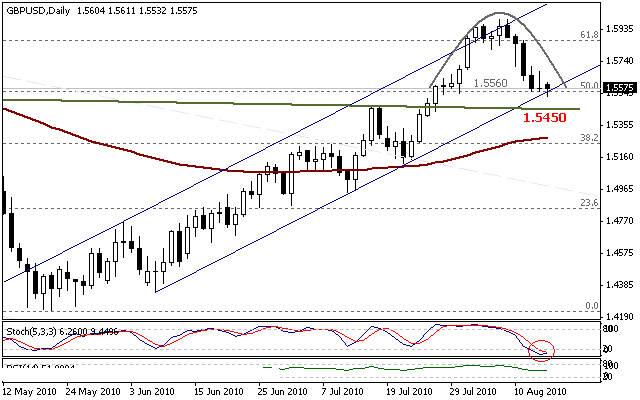
GBP
The pair successfully reached support for the key bullish channel shown above at 1.5560, which meets with 50% Fibonacci correction and accompanied by stochastic entering oversold areas; therefore, providing a chance for a bullish rebound that pushes the pair to the upside, but in return the negative formation could cause more negative pressure to breach the current support and retest the previously broken neckline that has currently turned into support at 1.5450. These signs make us recommend observing upcoming reports to obtain more accurate signs for the upcoming direction, where the breach of 1.5705 and stabilizing above it adds more strength to chances of continuing the expected bullish wave that according to its nature will start trading within price channels.
The trading range for today is among the key support at 1.5280 and the key resistance at 1.6030.
The short term trend is to the downside as far as 1.6070 remains intact with targets at 1.3800.
Support 1.5560 1.5515 1.5450 1.5410 1.5360
--------------------------------------------------------------------------------
Resistance 1.5600 1.5650 1.5705 1.5785 1.5815
--------------------------------------------------------------------------------
Recommendation Based on the charts and explanation above our opinion is observing the pairs movement to insure its upcoming direction.
-----------------------------------------
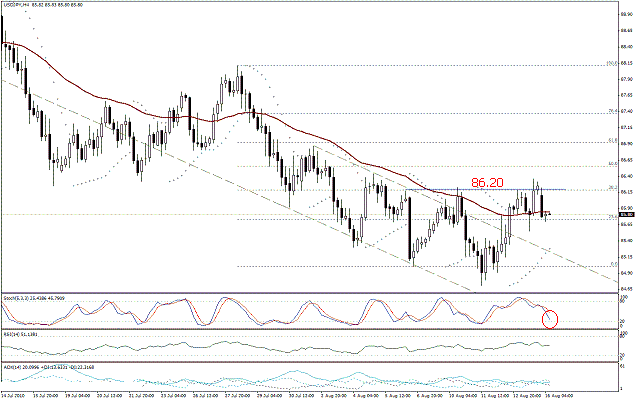
JPY
The pairs trading is hung between 23.6% and 38.2% Fibonacci correction, where this fluctuation is causing the pair to lose negative momentum appearing through the four hour chart; therefore, chances of activating the bullish technical scenario shown in our last reports are available. From here, we can expect a bullish trend this week that requires a clear breach of 86.20 to head towards 87.35 then 88.70. We point out that these expectations require stability above 85.25.
The trading range for today is among the key support at 84.00 and the key resistance at 88.70.
The short term trend is to the downside as far as 91.55 remains intact with targets at 82.60.
Support 85.75 85.25 84.70 84.00 83.50
--------------------------------------------------------------------------------
Resistance 86.20 86.55 87.00 87.35 87.95
--------------------------------------------------------------------------------
Recommendation Based on the charts and explanations above our opinion is buying the pair with the breach of 86.20 targeting 87.35 and stop loss below 85.30, might be appropriate.
-----------------------------------------
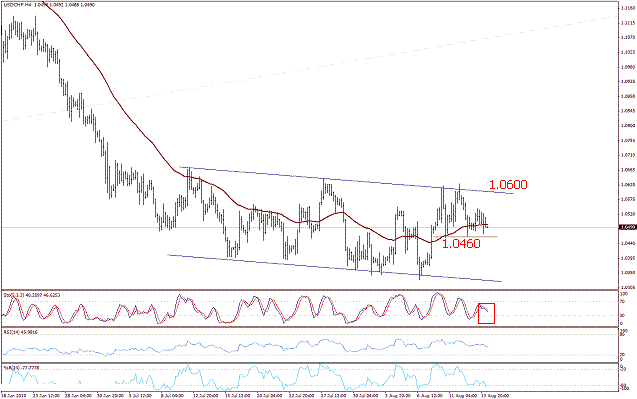
CHF
The pair continues trading within a sideway bearish range shown above, while obstacles of surpassing resistance continues and has currently descended to 1.0600. The stochastic is nearing oversold areas, where support continues minor support 1.0460 and pressuring the pair to the upside. In overall, we can expect a bullish trend this week supported by the bullish technical pattern shown in our reports like week that may be activated incase the pair succeeds in clearly breaching and stabilizing above 1.0600, where technical targets start at 1.0745 then 1.0900. Keep in mind that the breach of 1.0460 could postpone achieving bullish targets and lead to a bearish trend towards 1.0325.
The trading range for today is among the key support at 1.0325 and the key resistance at 1.0900.
The short term trend is to the upside as far as 1.0200 remains intact with targets at 1.1730.
Support 1.0460 1.0400 1.0325 1.0280 1.0200
--------------------------------------------------------------------------------
Resistance 1.0540 1.0600 1.0645 1.0670 1.0700
--------------------------------------------------------------------------------
Recommendation Based on the charts and explanations above our opinion is buying the pair with the breach of 1.0600 targeting 1.0745 and stop loss below 1.0500, might be appropriate.
-----------------------------------------
CAD
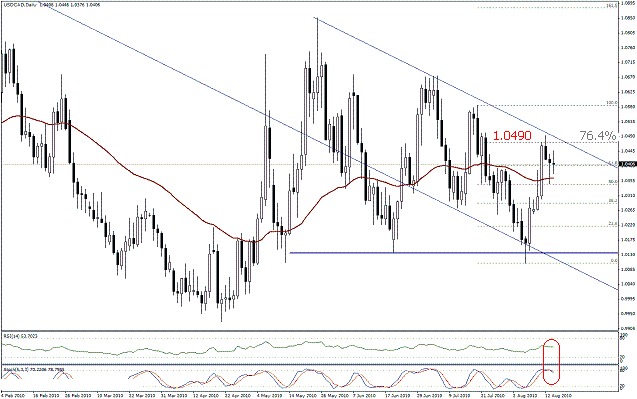
The 76.4% Fibonacci correctional level maintains its stance in front of the pairs ascending and currently meeting with resistance for the bearish channel at 1.0490 that organizes intraday trading. Momentum indicators are showing negative signs that make us expect a bearish direction reaching initial targets around 1.0135. Keep in mind that breaching 1.0490 and achieving a daily closing above it will pave the way towards resuming the bullish wave that the pair has started from 1.0105 in the beginning of this month.
The trading range for today is among the key support at 1.0135 and the key resistance at 1.0675.
The short term trend is to the upside as far as 0.9925 remains intact with targets at 1.1485.
Support 1.0345 1.0300 1.0255 1.0200 1.0170
--------------------------------------------------------------------------------
Resistance 1.0400 1.0445 1.0490 1.0585 1.0635
--------------------------------------------------------------------------------
Recommendation Based on the charts and explanations above our opinion is selling the pair around 1.0490 targeting 1.0345 and stop loss above 1.0600, might be appropriate.

_________________________________________________________________________________________________________________________________________
Related Topics

----------- EDUCATION ---------
-------TRADING METHODS ------
--------- FOR TRADERS ----------
-------------- OTHER ------------
Forex - Weekly Technical Analysis (16.0822.08)
_________________________________________________________